Posts
Geocoding An Intersection with Open Street Map data
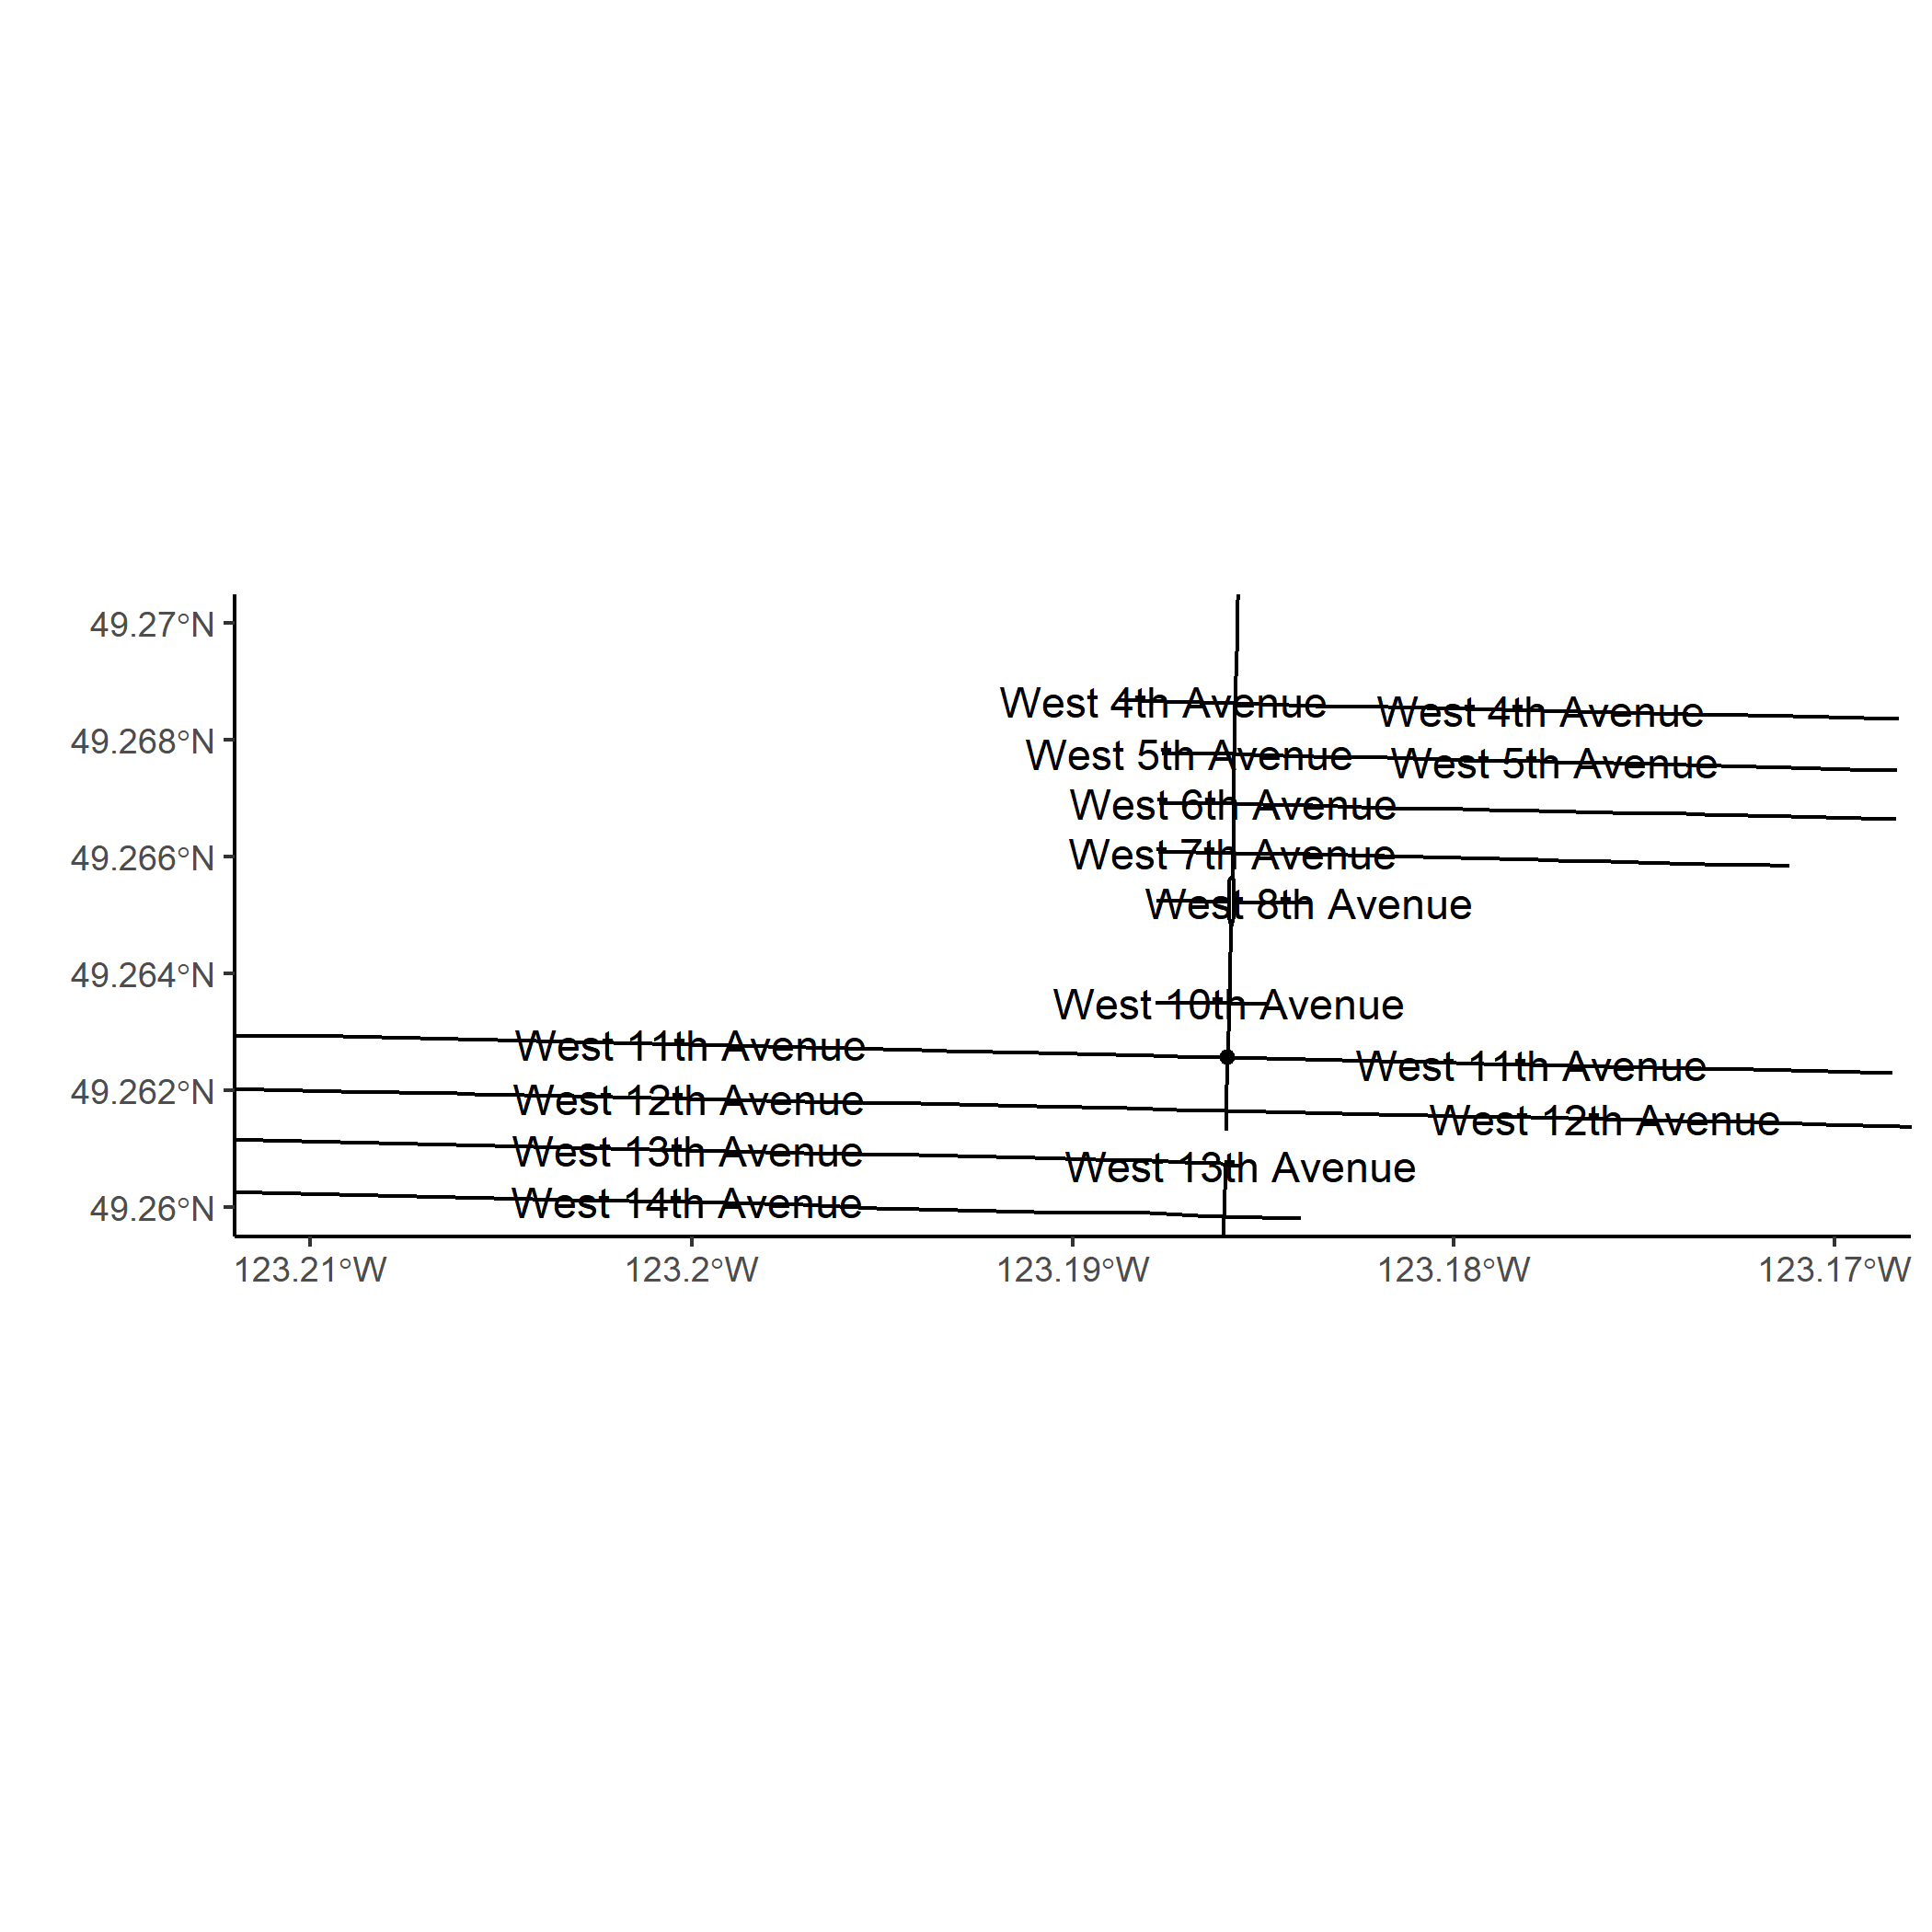
Sometimes, geographic information is given as street intersections rather than GPS coordinates or street addresses with house numbers. Intersections can be geocoded with Google Maps (Limited free usage with API), ArcGIS (paid software) or other web services which parse text and return coordinates. If you are lucky, there may be a government geocoding service for free.
On the other hand, you can perform your own geocoding of intersections by taking advantage of the detailed Open Street Maps data accessed with osmdata.
baRcodeR now on rOpenSci + online barcode PDF generation
Some major changes have occurred to baRcodeR since the last post on version 0.1.2 to ease the process of making printable labels like below.
As of baRcodeR 0.1.5:
After extremely helpful reviews, baRcodeR was accepted as part of the rOpenSci project.
Online documentation for the package is now available, generated with pkgdown and hosted by rOpenSci.
An interactive GUI in the form of a shiny RStudio addin is now available as part of the package.
baRcodeR 0.1.2 release - new linear barcodes
baRcodeR 0.1.2 is released on CRAN today!
Download and install by
install.packages("baRcodeR") Example linear barcode
The major feature of this release is the ability to print linear (a.k.a normal) barcodes through specifying type = "linear" in create_PDF() rather than type = "matrix" which prints the usual QR code.
The github repository is at yihanwu/baRcodeR.
Minor notes on the implementation of these linear barcodes The linear barcodes are based on the code 128B specification (Wikipedia).
Icon making with ggplot2 and magick
Icon
noun
A person or thing regarded as a representative symbol or as worthy of veneration.
A symbol or graphic representation on a screen of a program, option, or window.
from Oxford English Dictionaries
Fontawesome and the noun project along with other icon provides produce and distribute beautiful icons for free use. But sometimes, I would like to alter or create my own tiny 16x16 or 32x32 pixel wide icons without having to learn inkscape or any other svg editor.
Blogdown - shortcode for radix-like Bibtex
Generating a Bibtex citation in Hugo with a shortcode
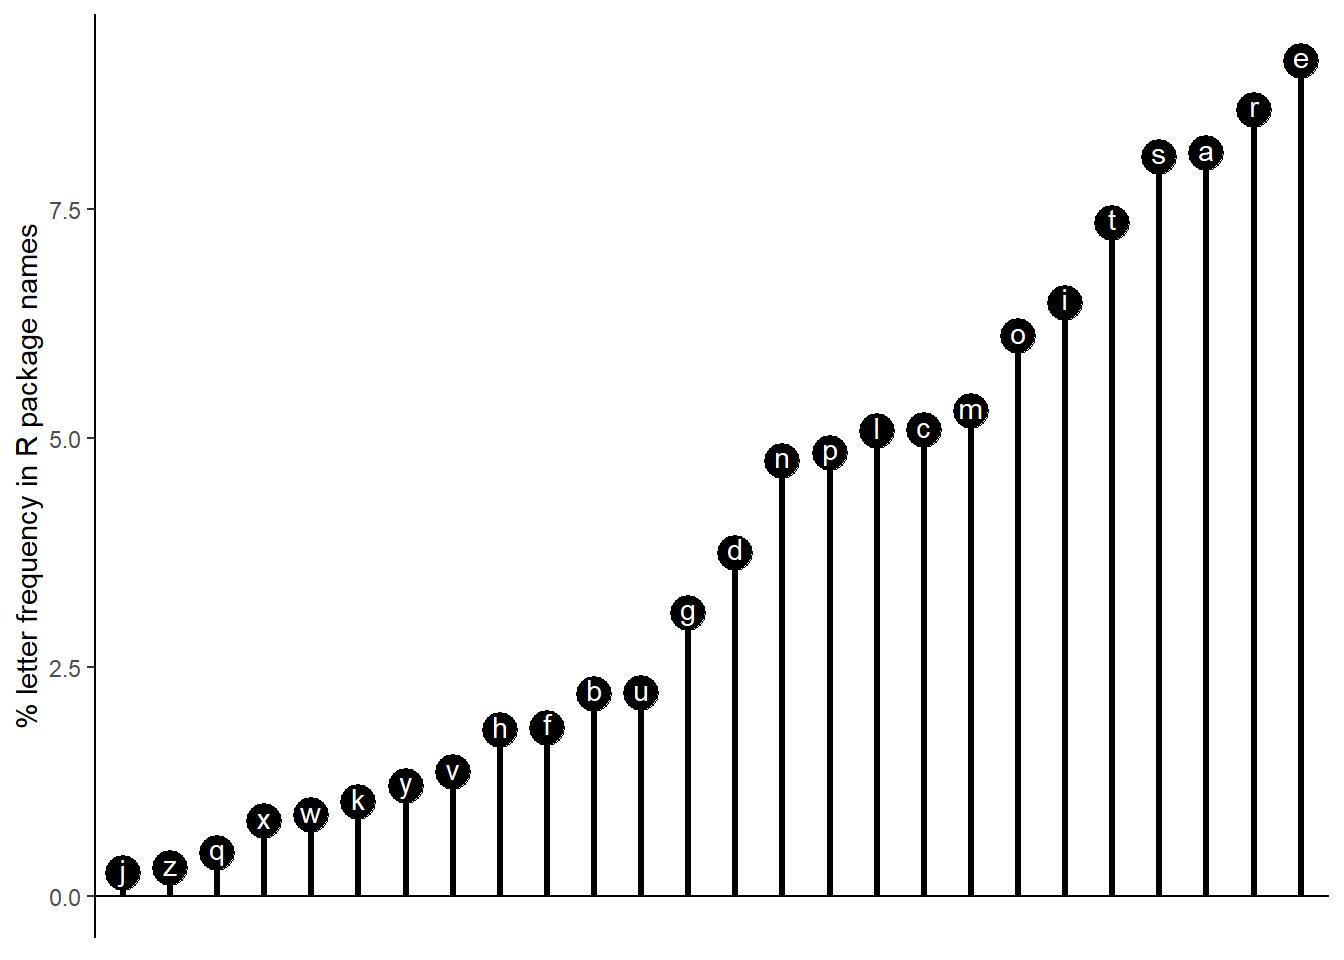
Rrrrs in R - Letter frequency in R package names
Do R package authors really like adding extra r’s to their package names?
Hugo Templating - Adding enclosure image in RSS feed
This is part of more mods for the Academic theme. In this case, I attempted to change the RSS feed to show the header image. R-Bloggers show the first image in the rss feed as the post image rather than the header image specified in the post. So I changed the rss template in the Academic theme to specify a featured image. The comments are most likely incorrect in some places since I am just learning how to use the Hugo templates but the line works.
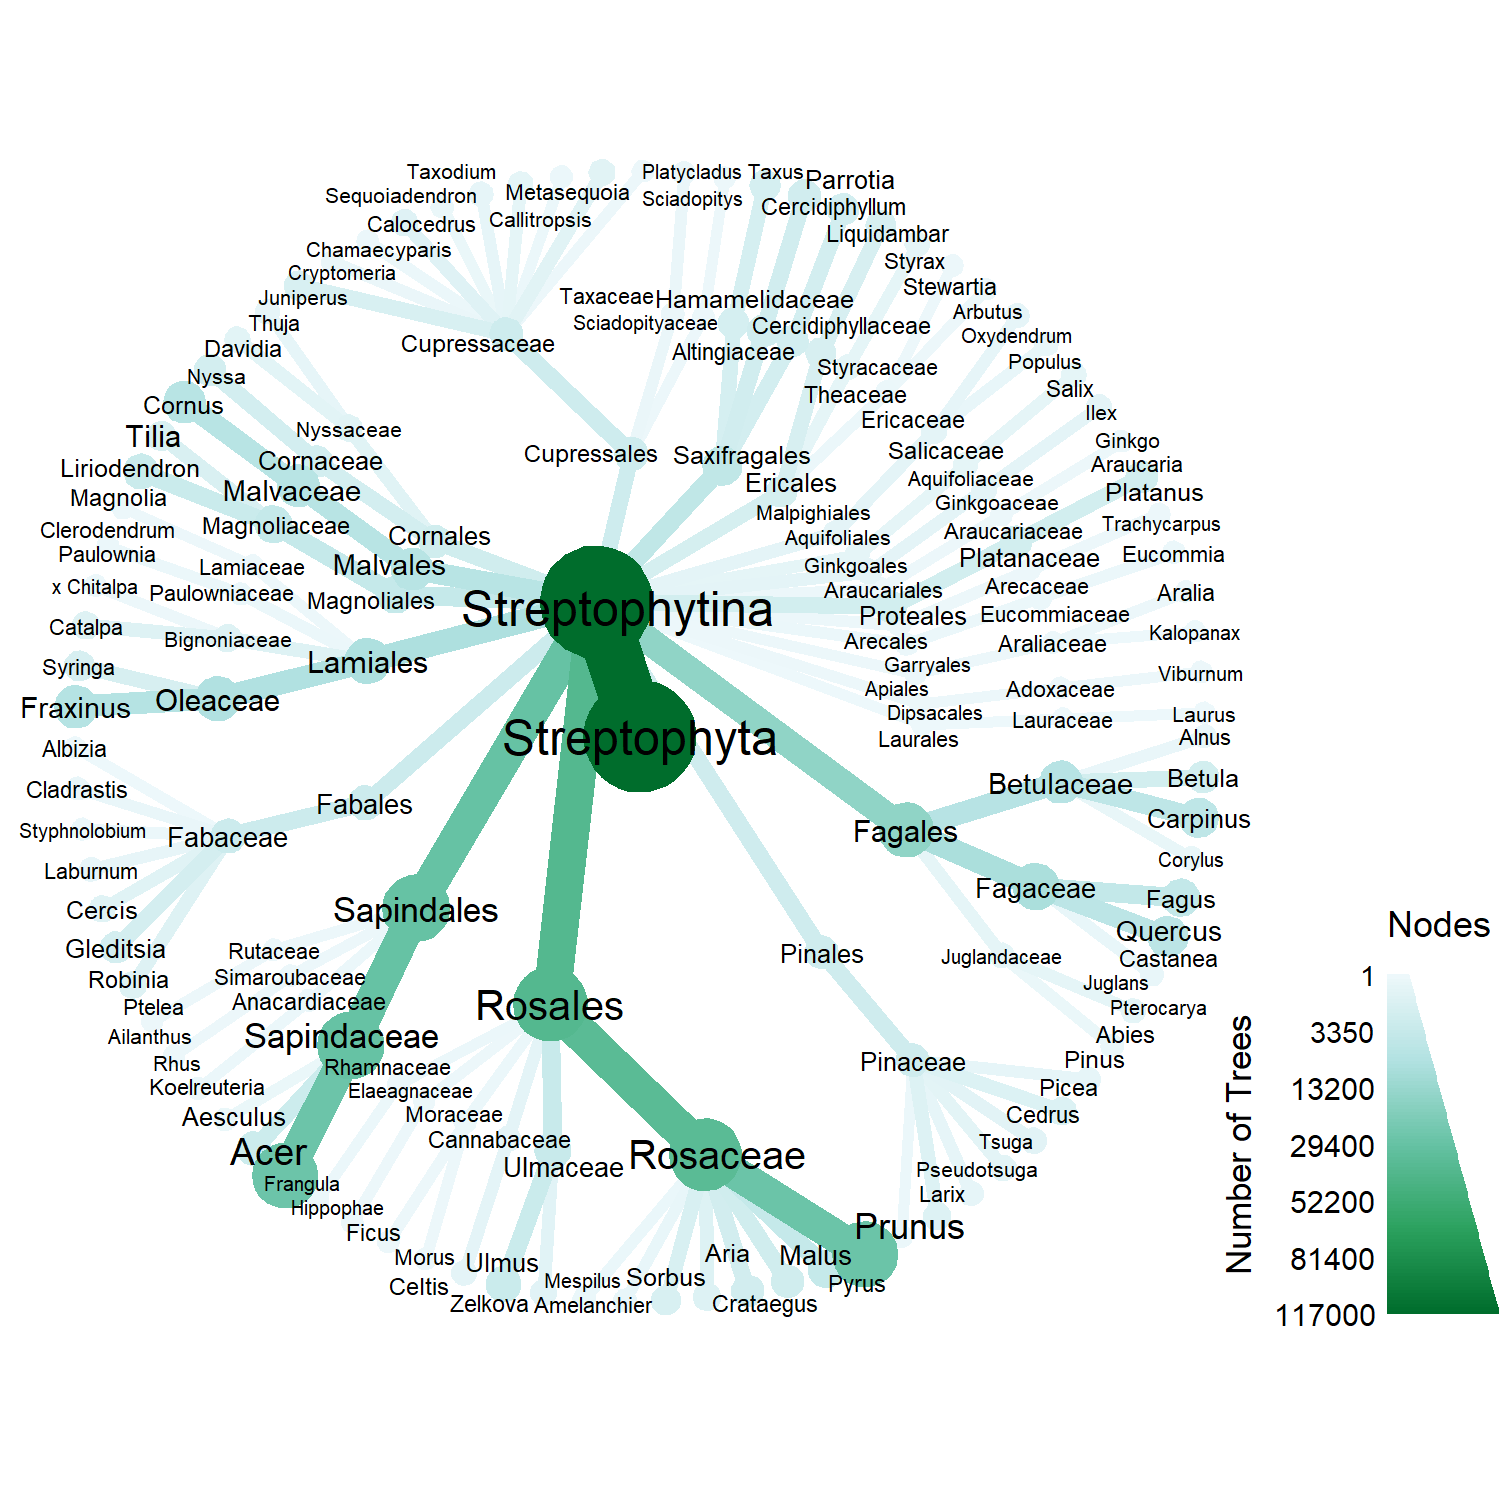
Using taxa and metacoder to explore taxonomy of Vancouver's trees
From the last post, Vancouver has several common genus in its collection, such as Prunus and Acer. So rather than analyzing the diversity of Vancouver tree species on a species level, we could, with the help of some R packages, visualize the variety of taxonomic groups.
First, we format the Vancouver tree dataset similar to before to get the proper scientific name. This is the same formatting done in the previous post.
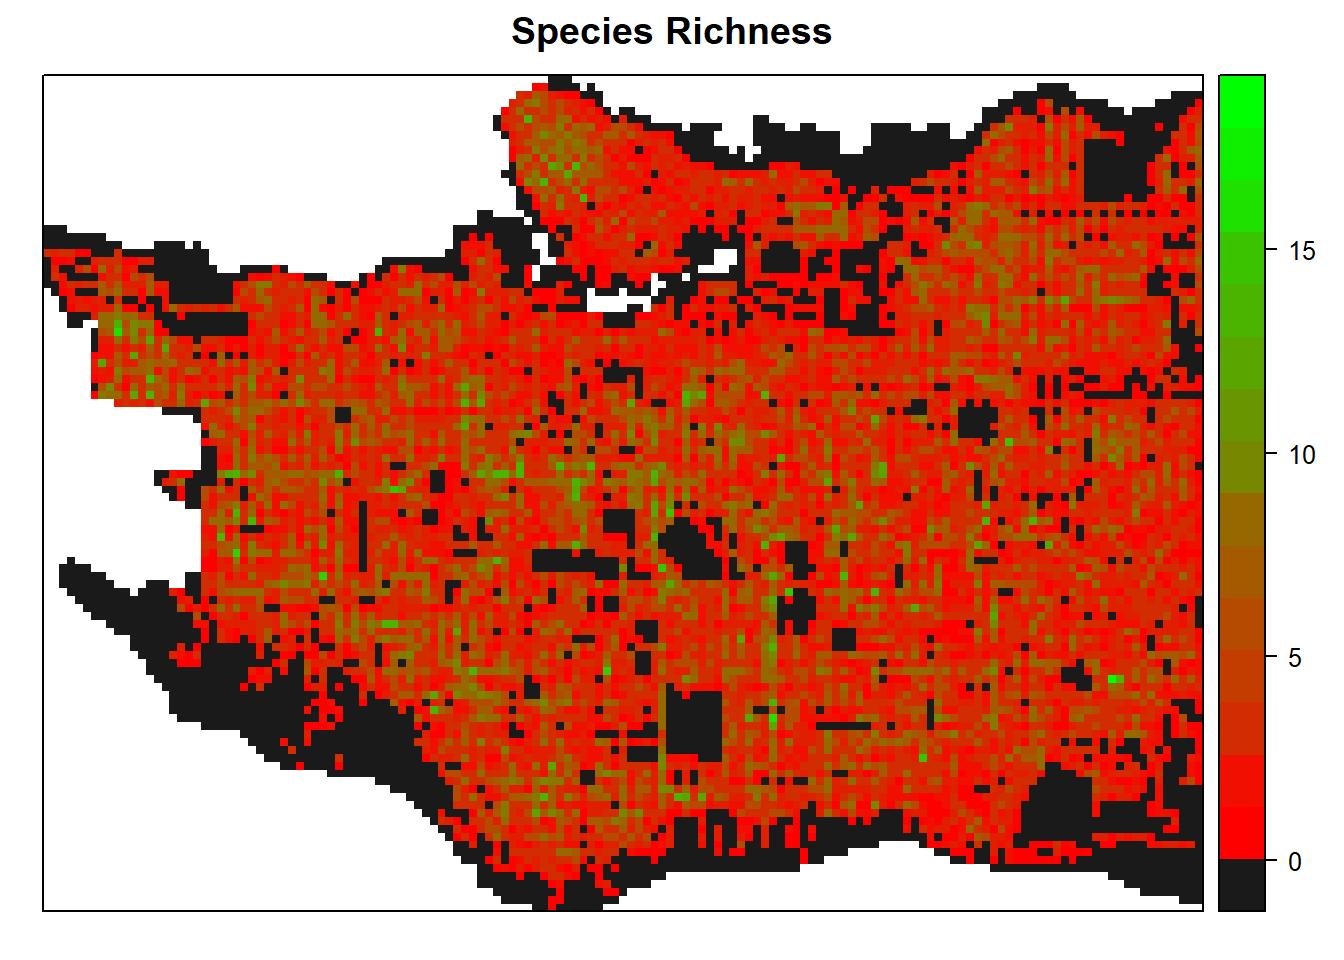
Vancouver Trees - Vizualizing biodiversity, native and introduced trees
Following from the past post, this post is focused on visualizing diversity through the package vegan and also maps showing the presence of native/introduced trees.
The most important code in this post is manipulating Spatial*DataFrames.
The same files will be read in, including the native/introduced status downloaded from USDA PLANTS.
library(rgdal) library(sp) library(raster) library(dplyr) library(httr) library(rvest) library(purrr) library(tidyr) # read in trees df trees_df<-read.csv("StreetTrees_CityWide.csv", stringsAsFactors = F) trees_df<-trees_df[trees_df$LATITUDE > 40 & trees_df$LONGITUDE < -100,] # read in polygons locmap<-readOGR("cov_localareas.